Boyd's Landscape of the United States 2010
© 2025 Boyd Ostroff
This map is locally hosted at boydsmaps.com
Link to this metadata:
boydsmaps.com/mapinfo/nlcd2010.html
Link to this map:
boydsmaps.com/#9.00/38.897575/-77.036601/nlcd2010/0.00/0.00
Originally published:
July 4, 2025
Most recent update:
none
Resolution:
125 feet (38.2 meters)
Map Tiles:
462,000 (this map) / 18,474,000 (complete series)
Size:
3.3 gb (this map) / 130 gb (complete series)
Data Sources
Multi-Resolution Land Characteristics Consortium (MRLC)
Annual National Land Cover Database
www.mrlc.gov/data
NASA EarthData
ASTER Global Digital Elevation Model
earthdata.nasa.gov/data/catalog/lpcloud-astgtm-002
Description
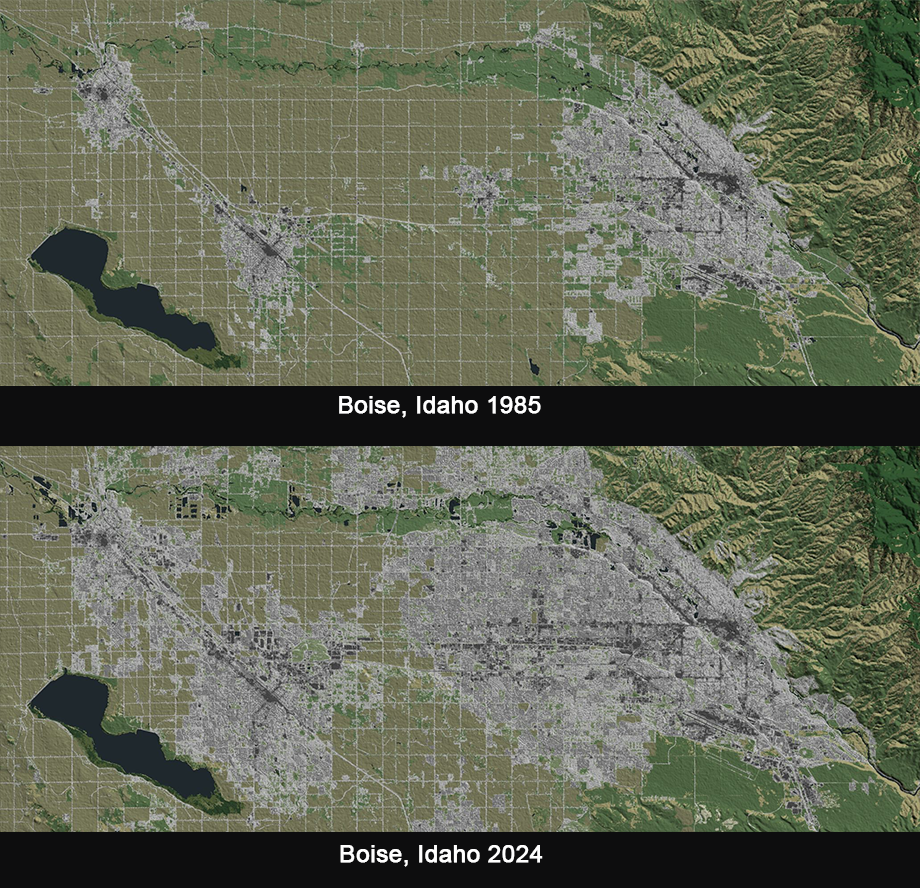
The changing face of America from 1985 to 2024. USGS land cover data combines with 3d terrain from NASA for a map that looks like aerial photography but is actually created procedurally. This is an advantage when comparing different years; photographs differ depending on the time, season, weather, exposure and so forth. But not the Landscape series because they're all created with the same procedure.
The downside is a lack of detail and relatively low resolution. You probably can't see what year an individual house was built but will see when the development was built.
The initial release of the Landscape series included maps every 5 years from 1985 to 2024 but was subsequently expanded to include all 40 years of annual maps.
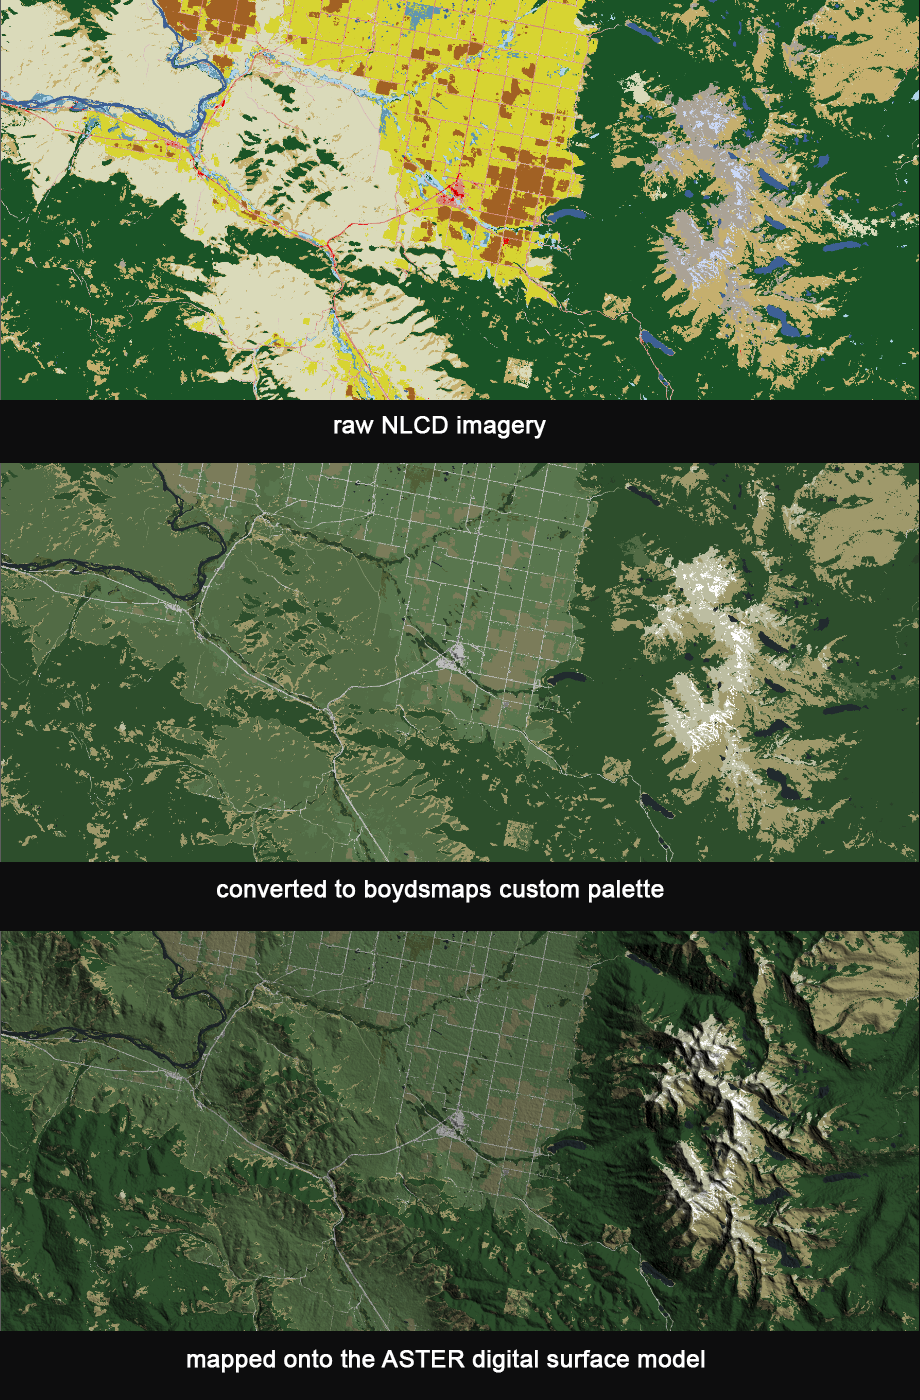
The USGS creates the Annual Land Cover Database from Landsat imagery by assigning one of the following types to each pixel. These values are then represented by a palette of 16 standard colors in the processed image.
open water
perennial ice/snow
developed, open space
developed, low intensity
developed medium intensity
developed high intensity
barren land
deciduous forest
evergreen forest
mixed forest
shrub/scrub
grasslands/herbacious
pasture/hay
cultivated crops
wooded wetlands
emergent herbacious wetlands
For this map, raw NLCD imagery was converted a special color palette and rendered in 3d as a texture map for an ASTER GDEM terrain model of the United States. Each annual map consists of about 80 million data points.
ASTER GDEM data captured between 2009 - 2011 is used for the 3d map surface. NASA explains how this differs from the bare-earth LIDAR at boydsmaps:
"The GDEMs are maps of Earth's surface derived from ASTER, an optical stereo instrument that observes the landscape, including its land cover. Consequently, GDEM generally maps the tops of dense land covers such as forests and urban areas (buildings). This is in contrast to the National Elevation Database, which is a bare-Earth model by design, and in contrast to GPS benchmarks, which always represent the bare Earth surface."
Notes
Although these maps were processed to preserve the full detail of the source datasets, the resolution of the original Landsat imagery just isn't adequate to show much detail. But they can be very useful for showing regional changes, such as the effects of drought or urban expansion over time. You can use our MapSync app to compare different years.
When viewing maps of different years, it's important to understand that the same ASTER GDEM surface model from 2009-2011 was used in all maps. So, although the landcover data is unique for each year, the terrain is the same.
Generally speaking, this isn't much of an issue because large geographic features like mountains don't change much and the map resolution is too low to show small features. But if a large feature like a strip mine was created in 2010, it would also be visible on all the earlier maps although the landcover itself would not show it. On the other hand, if that strip mine was enlarged in 2015, the terrain on subsequent maps wouldn't reflect this although the landcover itself would.
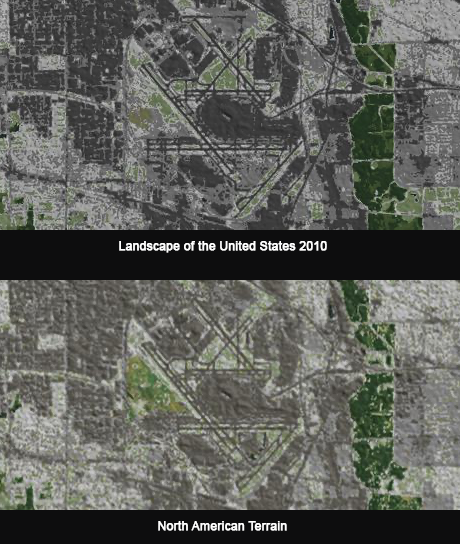
This series of Landscape maps is similar to our North American Terrain map which was created from NLCD 2011 data and ASTER gdem. But the maps in the Landscape series are based data that was re-processed by the USGS in 2024 to take advantage of deep learning and other technologies. The boydsmaps rendering style for the landscape series has also been updated to provide more clarity and better detail.
Credits
Annual NLCD team at the USGS Earth Resources Observation and Science Center (EROS) in Sioux Falls, SD
US Geological Survey (USGS), 2024 Annual NLCD Collection 1 Science Products: USGS data release, doi.org/10.5066/P94UXNTS
ASTER GDEM is a product of Japan's Ministry of Economy, Trade, and Industry (METI) and NASA.
NASA/METI/AIST/Japan Spacesystems and U.S./Japan ASTER Science Team. ASTER Global Digital Elevation Model. NASA Land Processes Distributed Active Archive Center, 2009, doi:10.5067/ASTER/ASTGTM.002
Resources
United States Geological Survey
Annual NLCD - The Next Generation of Land Cover Mapping
boydsmaps.com/mapinfo/docs/fs20253001.pdf
United States Geological Survey
Annual National Land Cover Database (NLCD) Collection 1 Science Product User Guide
mapinfo/docs/LSDS-2103_NLCD_User_Guide_v11.pdf
NASA Land Processes Distributed Active Archive Center, Joint Japan-US ASTER Science Team
ASTER Global Digital Elevation Model Version 2 - Summary of Validation Results
mapinfo/docs/Summary_GDEM2_validation_report_final.pdf
Use Constraints
This map is © 2025 Boyd Ostroff with all rights reserved. It is provided free of charge for personal, non-commercial, non-organizational use but is not open source software. It may not be published or re-distributed in any form without the written consent of the author. Reasonable usage of map screenshots is permitted as long as they are attributed to boydsmaps.com (preferably with a link to the actual map).
Distribution Liability
Unless otherwise stated, all data, metadata and related materials are considered to satisfy the quality standards relative to the purpose for which the data were collected. Although these data and associated metadata have been reviewed for accuracy and completeness and approved for release by the US Geological Survey (USGS), no warranty expressed or implied is made regarding the display or utility of the data for other purposes, nor on all computer systems, nor shall the act of distribution constitute any such warranty.
Map software is provided "as is", without any express or implied warranty. In no event will boydsmaps.com be held liable for any damages arising from the use of this software. The user assumes all risks associated with the use of this software. boydsmaps.com will not be held responsible for any inaccuracies and no responsibility is assumed for damages or other liabilities due to errors, installation, accuracy, availability, use or misuse of the data presented.